Question:
What impact do different weightings of pandemic years of data in the CMI mortality projections model have on future pension liabilities?
Answer:
It depends. Introducing pandemic era data into your future improvement assumption will lead to a reduction in pension fund liabilities. The extent to which will depend on the approach you take and how much weight you assign to each year of pandemic data.
The detail:
CMI_2022 allows users to decide how much weight to place on 2020, 2021 and 2022 mortality data (if any). The different weightings will affect the level of improvements projected into the near future (or “initial rates” of improvement), and will in fact also have an effect on historical improvement rates due to the smoothing effect of the model. Users can place no weight (0%) to full weight (100%) to each of the three years through the use of the W parameters, W2020, W2021 and W2022.
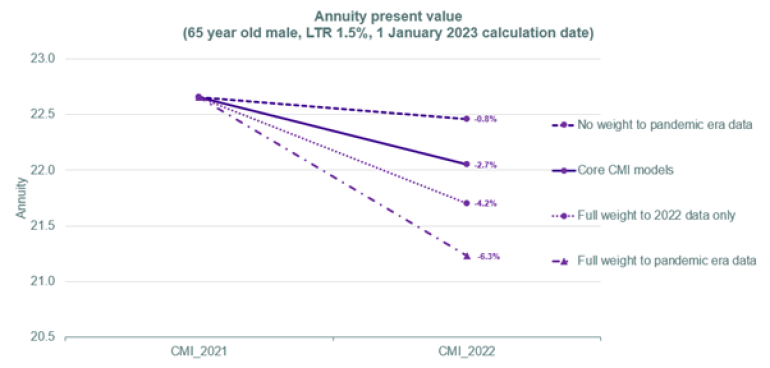
The chart below illustrates the liability impact of moving from the CMI_2021 core model to various versions of the CMI_2022 model, by flexing the W parameters:

Notes: The annuity values shown are for men at age 65, based on the S3PMA base table, with a net interest rate of 0% p.a. and assuming a long term rate of 1.5% p.a. in each case. “No weight to pandemic era data” means W2020=W2021=W2022=0%. “Core CMI model” means W2020=W2021 =0%, W2022=25%. “Full weight to 2022 data only” means W2020=W2021 =0%, W2022=100%. “Full weight to pandemic era data” means W2020=W2021=W2022=100%. Figures denote the percentage impact relative to the CMI_2021 core model. The calculation date is set to 1 January 2023 throughout. The CMI_2021 core model placed no weight on pandemic era data. The CMI_2022 core model places 25% weight to 2022 data.
Key takeaways:
- Introducing pandemic era data in your future improvement assumption, using the W parameter in the CMI_2022 model, will change the trajectory of projected life expectancy and reduce liabilities. The extent to which will depend on how much weight you assign to each year.
- The core CMI_2022 model has the effect of reducing liabilities by 2.7% compared to using the CMI_2021 model. This liability impact is roughly halfway between the impact of placing no weight and placing full weight to 2022 data, achieved by placing 25% weight to 2022 data.
- There are various approaches you can take to capture the impact of the pandemic in longevity projections which we explored in our recent Top Charts Post COVID Longevity Landscape – Change in Trajectory or Step Change? Using the core CMI_2022 model leads to a change in trajectory for life expectancy projections versus previous expectations.
We note that using the core parameterisation of the CMI_2022 model does not significantly impact historical improvement rates. However, there is a larger impact on these historical rates as the weighting to pandemic era data is increased – meaning more care will be needed the further away the central year of your base table is from present day. This could become more significant in next year’s release given the proposal to increase the weighting to 2023 data in the core parameterisation. We plan to explore this issue in more detail in a subsequent article.
The key questions are:
- Is recent mortality data representative of the future?
- If so, what is it representative of? A change in trajectory of life expectancy improvement, a step change in baseline mortality, some combination, or something else completely?
- What’s the best way to capture the impact of recent data in longevity projections to avoid double counting (considering the interaction between base tables and improvement tables)?
- How much weight should pension schemes place on recent data (if any)?


